Depreciation Curves: How Business Jets Hold Value, With 10-Year Residual Estimates by Category
The shape of a business jet's value curve, what bends it, how the 2021-2024 cycle distorted it, and our residual value estimates for every category at years one, five and ten.
By JetAtlas · Published 2026-08-27 · 9 min read · How we check facts
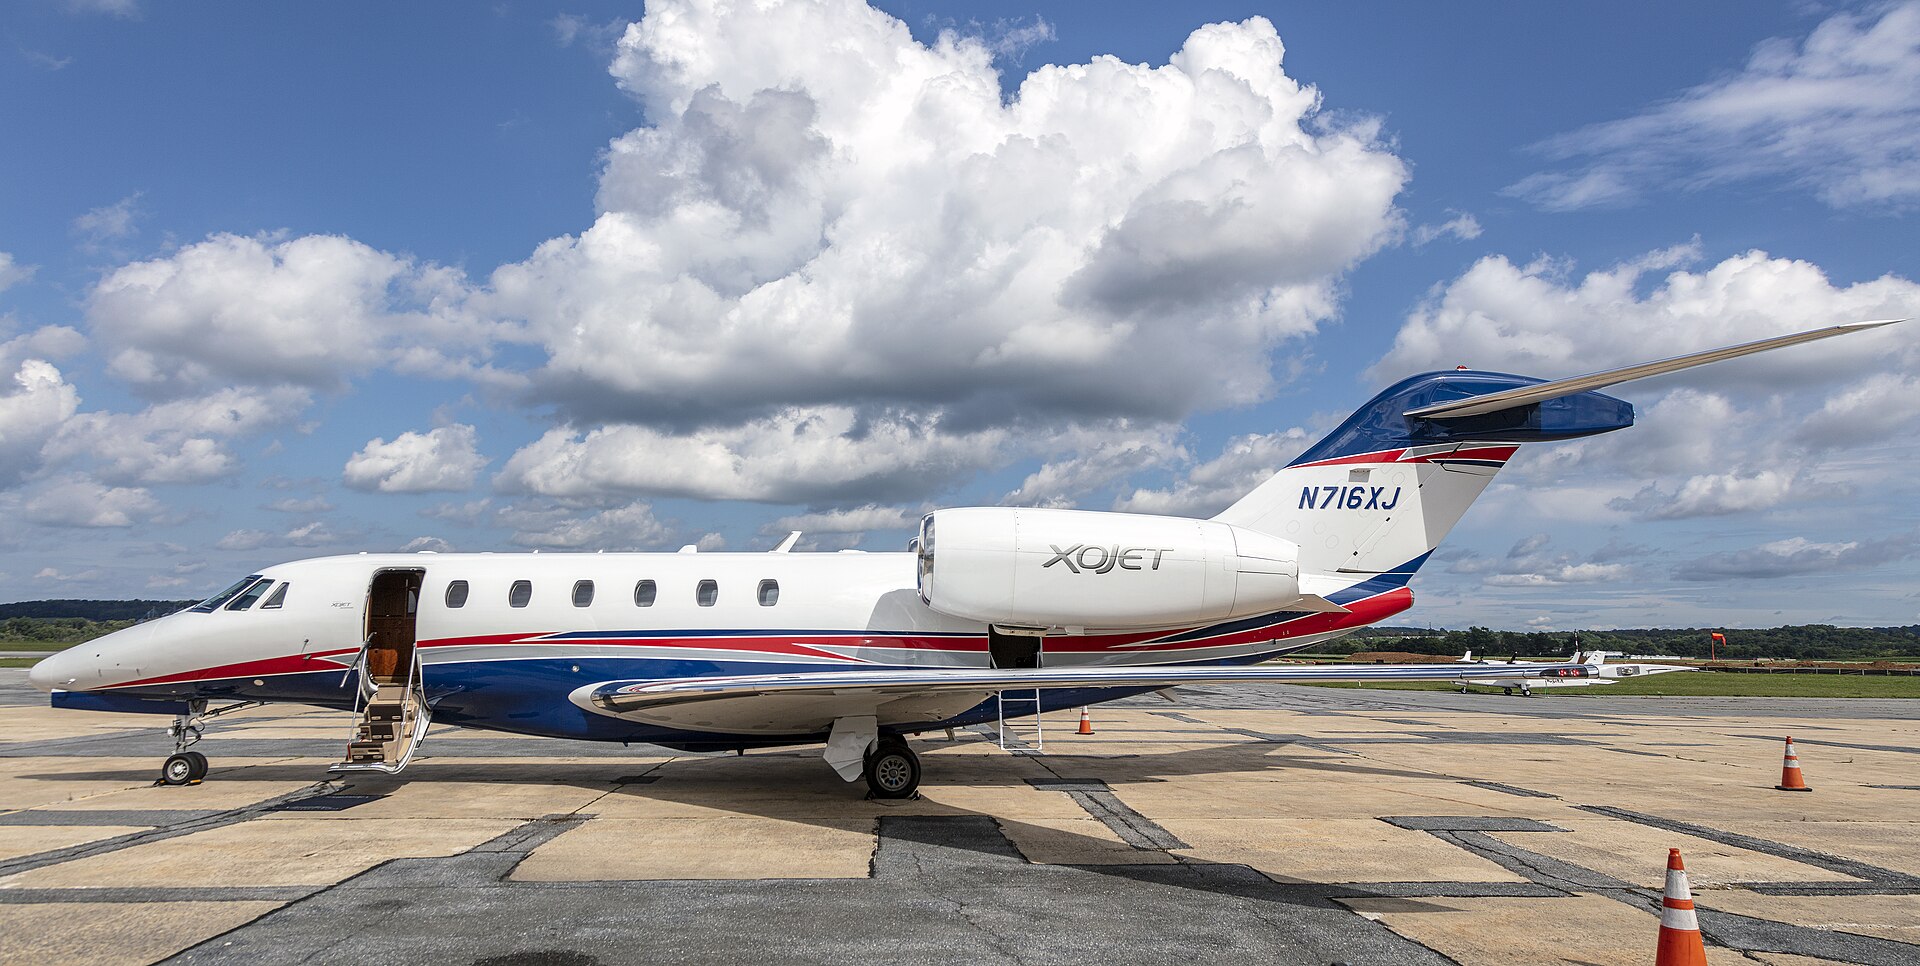
Depreciation is the largest cost of owning a business jet and the least visible. No invoice arrives; the loss is discovered at the exit, when the market tells you what the aircraft is worth. Understanding the shape of the value curve, and what bends it, is therefore the most valuable piece of financial analysis a buyer can do before signing. This report describes the curve, the factors that move individual aircraft above or below it, the distortion of the 2021-2024 cycle, and our residual value estimates by category as of mid-2026.
The shape of the curve
Across cycles and categories, business jet values follow a recognisable path.
- Year one: 10 to 15 percent. The moment a new aircraft leaves the factory it becomes a pre-owned aircraft. Buyers of one-year-old jets expect a discount for not choosing the specification, for the hours flown and for the simple absence of new-aircraft status.
- Years two to five: 5 to 8 percent a year. The steady phase, driven by ageing, hours accumulated and the arrival of newer competing models.
- Years six to ten: 4 to 7 percent a year. Depreciation slows in percentage terms as the base shrinks, but major inspections and interior refurbishment fall due, and buyers price them in.
- Years ten to twenty: 3 to 6 percent a year, punctuated by step-downs at major inspections, engine overhauls and the announcement of a successor model.
- Beyond twenty years: values converge toward part-out or scrap value, typically 5 to 10 percent of original price, and the aircraft's marketability depends on cost of the next big maintenance event rather than on its age.
The curve is steepest for the smallest aircraft and the least popular models, and flattest for large-cabin aircraft from dominant product lines with global demand.
What bends the curve
Six factors determine whether an individual aircraft sits above or below the category average.
- Product line strength. Aircraft from families with a large installed base, an active manufacturer support programme and a clear successor (Gulfstream's G550 to G600 to G700 lineage, the Phenom 300 series, the Challenger 300 series) hold value best. Orphaned or low-volume types (Learjet after 2022, the Hawker family, early Citation Mustangs) depreciate fastest.
- Maintenance programme coverage. Engines and airframe on hourly programmes add a premium of roughly the accrued value, and just as importantly they remove the buyer's fear of a large event.
- Records and pedigree. Complete, well-organised records, no damage history, one or two owners, and an operating history in a dry, temperate climate can be worth 5 to 10 percent.
- Hours relative to age. Low hours are generally good, but very low hours suggest idle time and raise their own concerns; the sweet spot is 300 to 500 hours a year.
- Configuration and avionics. Mandate compliance, modern connectivity and a neutral, well-maintained interior sell; unusual layouts and dated cabins discount.
- Currency and geography. Aircraft based in the largest markets, registered on liquid registries and priced in dollars sell into the deepest pool of buyers.
The 2021-2024 distortion
The pandemic cycle broke the curve temporarily. From mid-2021 to late 2022, pre-owned prices for late-model aircraft rose 20 to 40 percent as demand surged and new aircraft were unavailable; some two-year-old aircraft sold above their original purchase price. Values then fell through 2023 and 2024 as inventory rebuilt, and by mid-2025 most categories were back on a curve that runs roughly 5 to 10 percent above the pre-pandemic trend. The lesson is not that jets appreciate; it is that the timing of purchase and sale within a cycle can move a five-year outcome by 15 to 25 percentage points, dwarfing the difference between one model and another.
Residual value estimates by category, mid-2026
The estimates below are for a new aircraft delivered in 2026 at typical equipped price, on programme, with average utilisation and complete records, sold into a normal market. Residual value is expressed as a percentage of original price in nominal dollars.
| Category | Representative models | Year 1 | Year 5 | Year 10 | Notes |
|---|---|---|---|---|---|
| Very light | Vision Jet, HondaJet Elite II, Citation M2 Gen2 | 85 | 62 | 42 | Vision Jet supported by large owner base; HondaJet weaker pending Echelon |
| Light | Phenom 300E, CJ4 Gen2, PC-24 | 88 | 68 | 50 | Phenom 300E and PC-24 at top of band, fractional demand supportive |
| Midsize | Citation Latitude, XLS Gen2, Praetor 500 | 87 | 66 | 48 | Latitude supported by NetJets fleet; Praetor 500 rising |
| Super-midsize | Challenger 3500, Praetor 600, Longitude, G280 | 88 | 68 | 50 | Challenger 3500 at top; G280 lower pending successor |
| Large cabin | Challenger 650, Falcon 2000LXS, Falcon 6X, G500 | 87 | 66 | 47 | Falcon 6X and G500 stronger than older designs |
| Long range | Global 5500/6500, G600, Falcon 8X | 88 | 68 | 50 | Falcon 8X and G600 strong; Global 6500 competitive |
| Ultra-long-range | G700, G800, Global 7500/8000 | 92 | 74 | 55 | Strongest category; G700 and Global 7500 carry near-new premium through 2027 |
| Bizliner | ACJ320neo, BBJ 737-8 | 80 | 55 | 35 | Highly configuration dependent; narrow buyer pool |
Two cautions. First, these are category midpoints; within a category the spread between the best and worst individual aircraft can exceed 20 percentage points at year ten. Second, the ultra-long-range figure assumes the current shortage of delivery positions persists through 2027; if the manufacturers meet their ramp targets and the Falcon 10X arrives on schedule in 2029, the near-new premium on the G700 and Global 7500 will erode and the year-five figure could be closer to 68 than 74.
A worked example
Consider two aircraft purchased new in 2026 for the same 27 million dollars: a Challenger 3500 and a hypothetical low-volume competitor with equivalent capability but a small fleet. At year five the Challenger, on programme with clean records, sells for roughly 18.4 million dollars; the competitor, with a thin pre-owned market and lender reluctance, for perhaps 15 million. The 3.4 million dollar difference is equivalent to more than a year of the Challenger's total operating cost, and it arrives in a single transaction. This is why the residual value column belongs at the top of the acquisition analysis, not the bottom.
What buyers can do
- Buy from product lines with large fleets and clear successors, and be sceptical of aircraft whose main selling point is a low price.
- Keep everything on programme and keep the records perfect; the cost is recovered at exit.
- Plan the exit before the entry: a sale after a major inspection with a fresh interior, in a strong market, into the deepest registry, is worth more than any negotiation on the way in.
- Watch the cycle. In mid-2026 inventory is tight, prices for late-model aircraft are stable and the pre-owned market rewards sellers of aircraft under ten years old. That may not be true in 2028.
- Model depreciation as a cash cost in the annual budget, even though no invoice arrives. Owners who do this rarely regret their purchase; those who do not are frequently surprised.
The aircraft is a depreciating asset. The question is only how fast, and that answer is largely within the buyer's control.
Mentioned in this story
More insights

What luxury really means on a VIP airliner
A VIP airliner is not just a larger private jet. Its real luxury is measured in certified space, sleep, quiet systems, completion time, crew workflow and the ability to carry a household or delegation across oceans without turning the cabin into theatre.
Farnborough, Biggin Hill or Luton: choosing a London private jet airport
Compare the final ground destination, operating window, aircraft requirements and handling arrangements before choosing a London airport.

Teterboro, Westchester or Morristown: choosing a New York private jet airport
Compare the airport and ground destination together, then check handling, timing, noise requirements and a fallback before accepting a charter proposal.